Analyzing Draymond Green's impact on rebounding and transition offense
Analyzing Draymond Green's impact on rebounding and transition offense
Part 2: An in-depth look at how Golden State regresses with All-Star forward away
For as undersized as the Warriors are, with no active player taller than 6-foot-9, their eighth-place ranking in total rebounding might come as a surprise. Kevon Looney has crashed the offensive glass. Guards have pitched in. A true team effort.
Over the past 20 games, with Draymond Green nursing a back injury and no return date in sight, the patchwork glasswork has shown signs of cracking. Green’s return is vital for many reasons. Tuesday I broke down his impact on the team’s 3-point shooting. Today’s part two looks at his impact on rebounding and transition offense.
PART 2: REBOUNDING AND TRANSITION
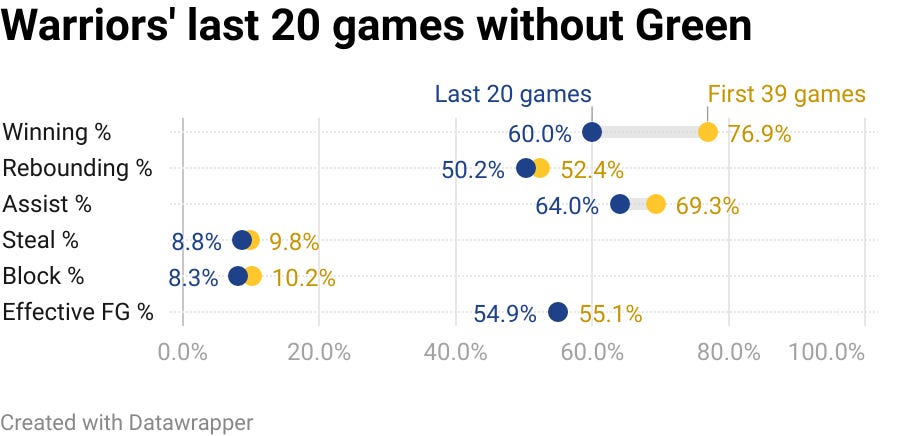
Here are Golden State season stats following Green’s most recent game, a January 9 win over the Cavs: 76.9 win percentage, 52.4% rebounding percentage and 69.3% of field goals were assisted. Those numbers have taken a hit during 20 games without the do-everything forward, and Golden State has a 12-8 record (60.0%) in that time.
The below graph plots Golden State players’ impact on pace of play (vertical axis) and rebounding percentage (horizontal axis). With Green on the court, Golden State averages 2.9 more possessions per 48 minutes (third-best pace on team) and has a 1.4% rebounding advantage (second to Looney). Because of Green’s ability to initiate the fast break — unlike Looney, who doesn’t have the same court awareness, speed and ball-handing — Green’s rebounding and team pace of play go hand-in-hand.
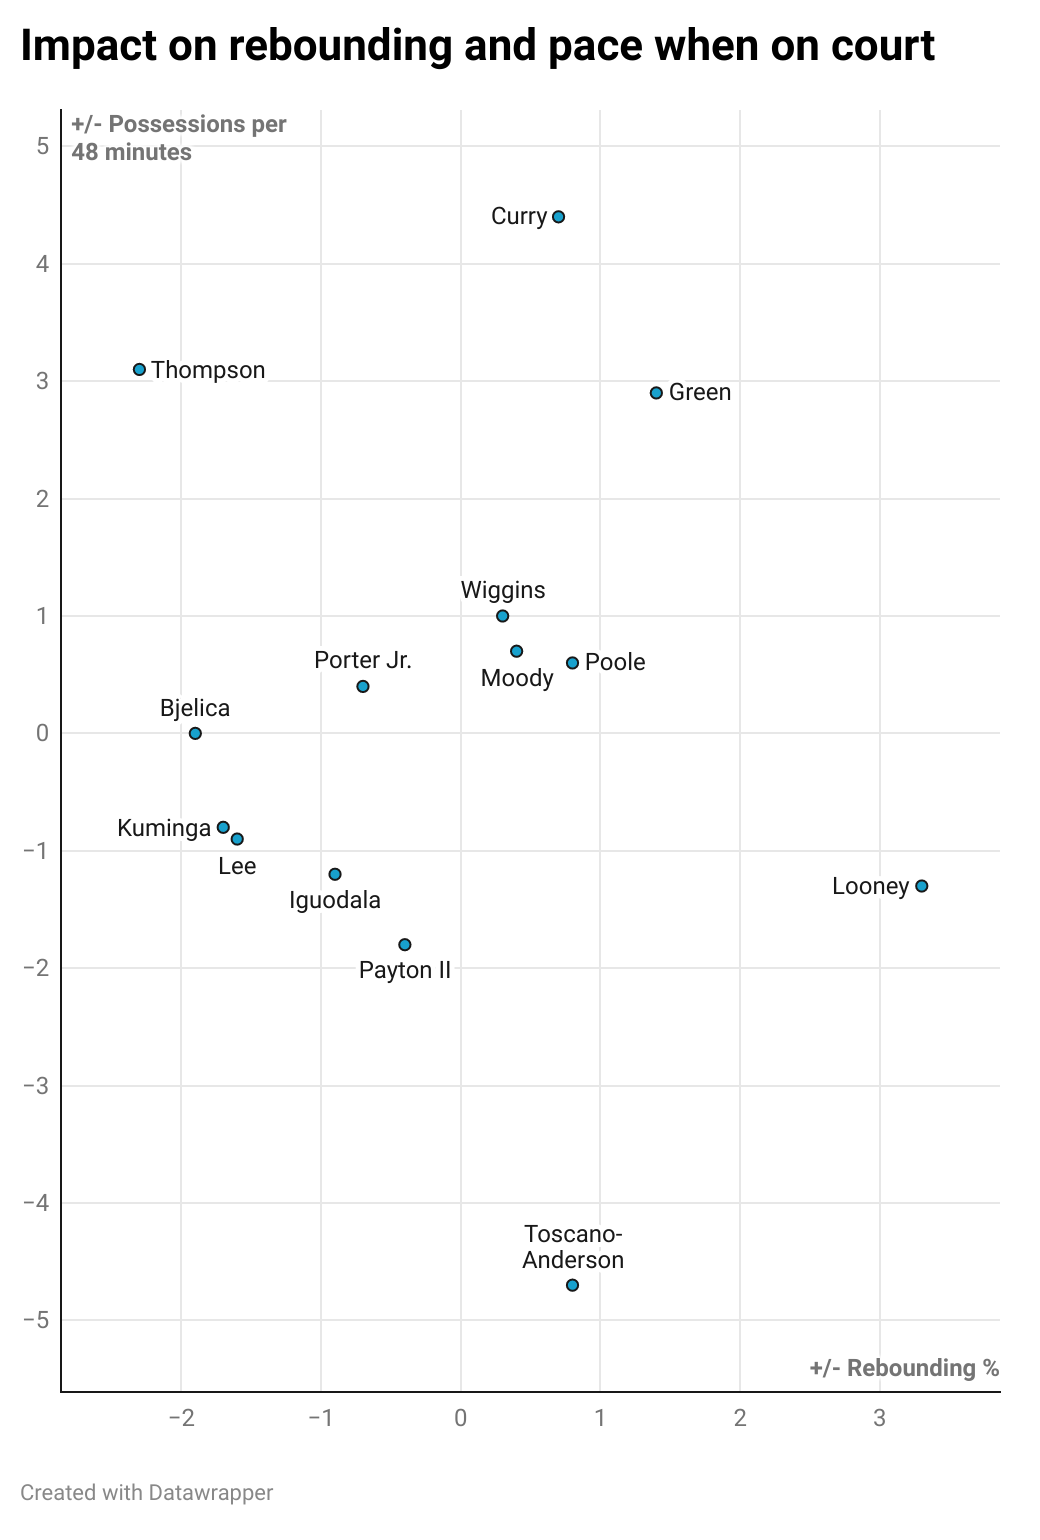
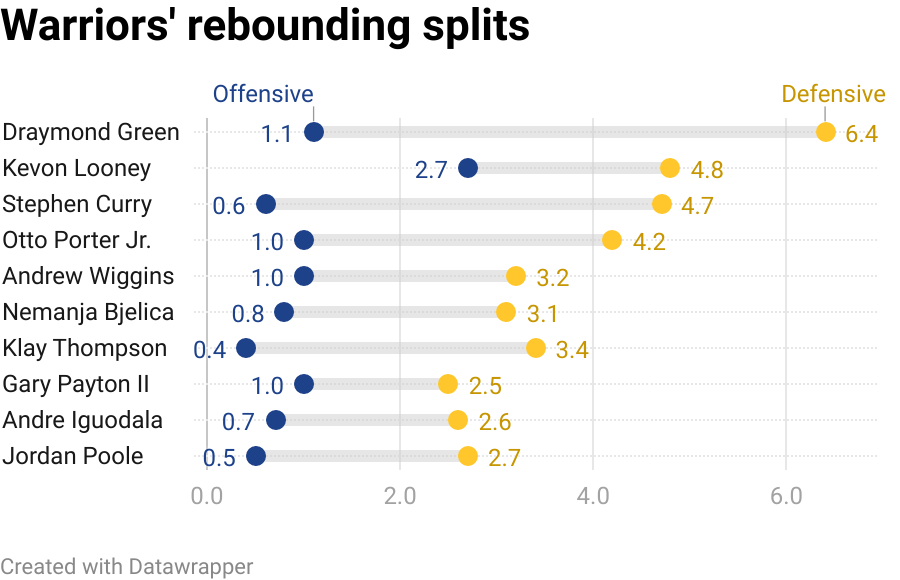
While Looney has been most effective on the offensive glass, creating second-chance points for the best shooters in the world, Green does his damage on the defensive boards. Golden State grabs 3.0% more defensive rebounds with Green on the court.
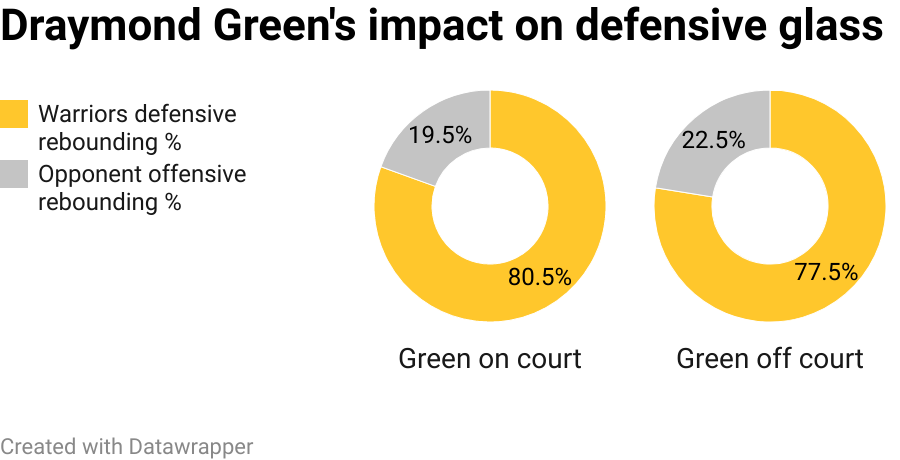
At 6.4 defensive rebounds per game, Green averages 1.6 more than the next best teammate (Looney, 4.8). Green’s defensive rebounding limits second-chance chances for foes. Warriors opponents averaged 9.4 offensive rebounds over the first 39 games (Green played in 34), and 10.7 with Green missing the last 20. That equates to more second-chance baskets for opponents and fewer fast breaks for the Warriors.
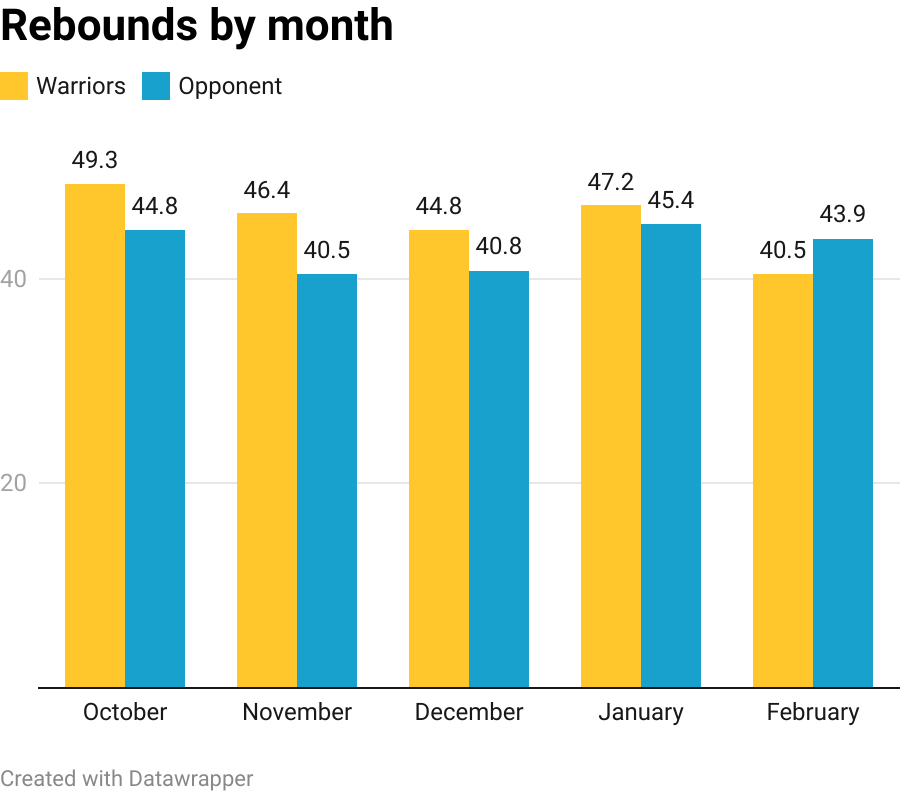
In February, the Warriors are being outrebounded for the first month this season. The most glaring occurance came in a February 9th loss to Utah, when the Rudy Gobert-less Jazz outrebounded them 52-35. The next night, the visiting Knicks beat Golden State with a 51-38 rebounding advantage. Six days later, Nikola Djokic and the Nuggets won with a 48-37 advantage. The Warriors have been outrebounded in five of six games, and their five worst rebounding performances are since January 23.
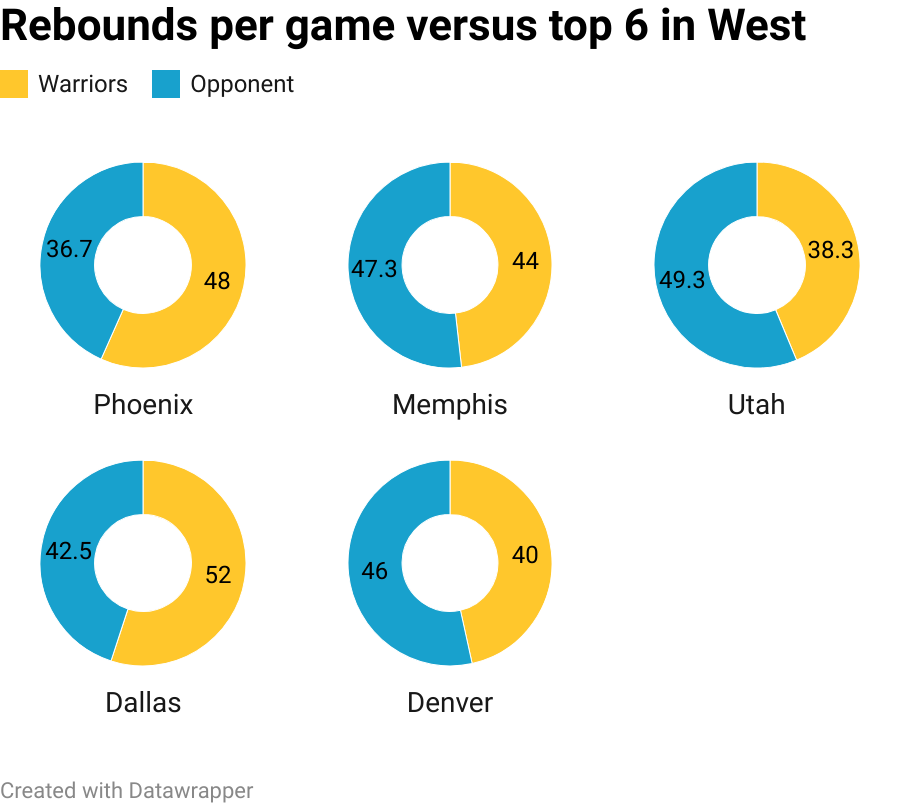
Golden State, which currently has the No. 2 seed in the Westen Conference, has rebounding deficits against three of the other top six West teams. Their biggest nemisis has been Utah, which averages 11 more rebounds in three games.
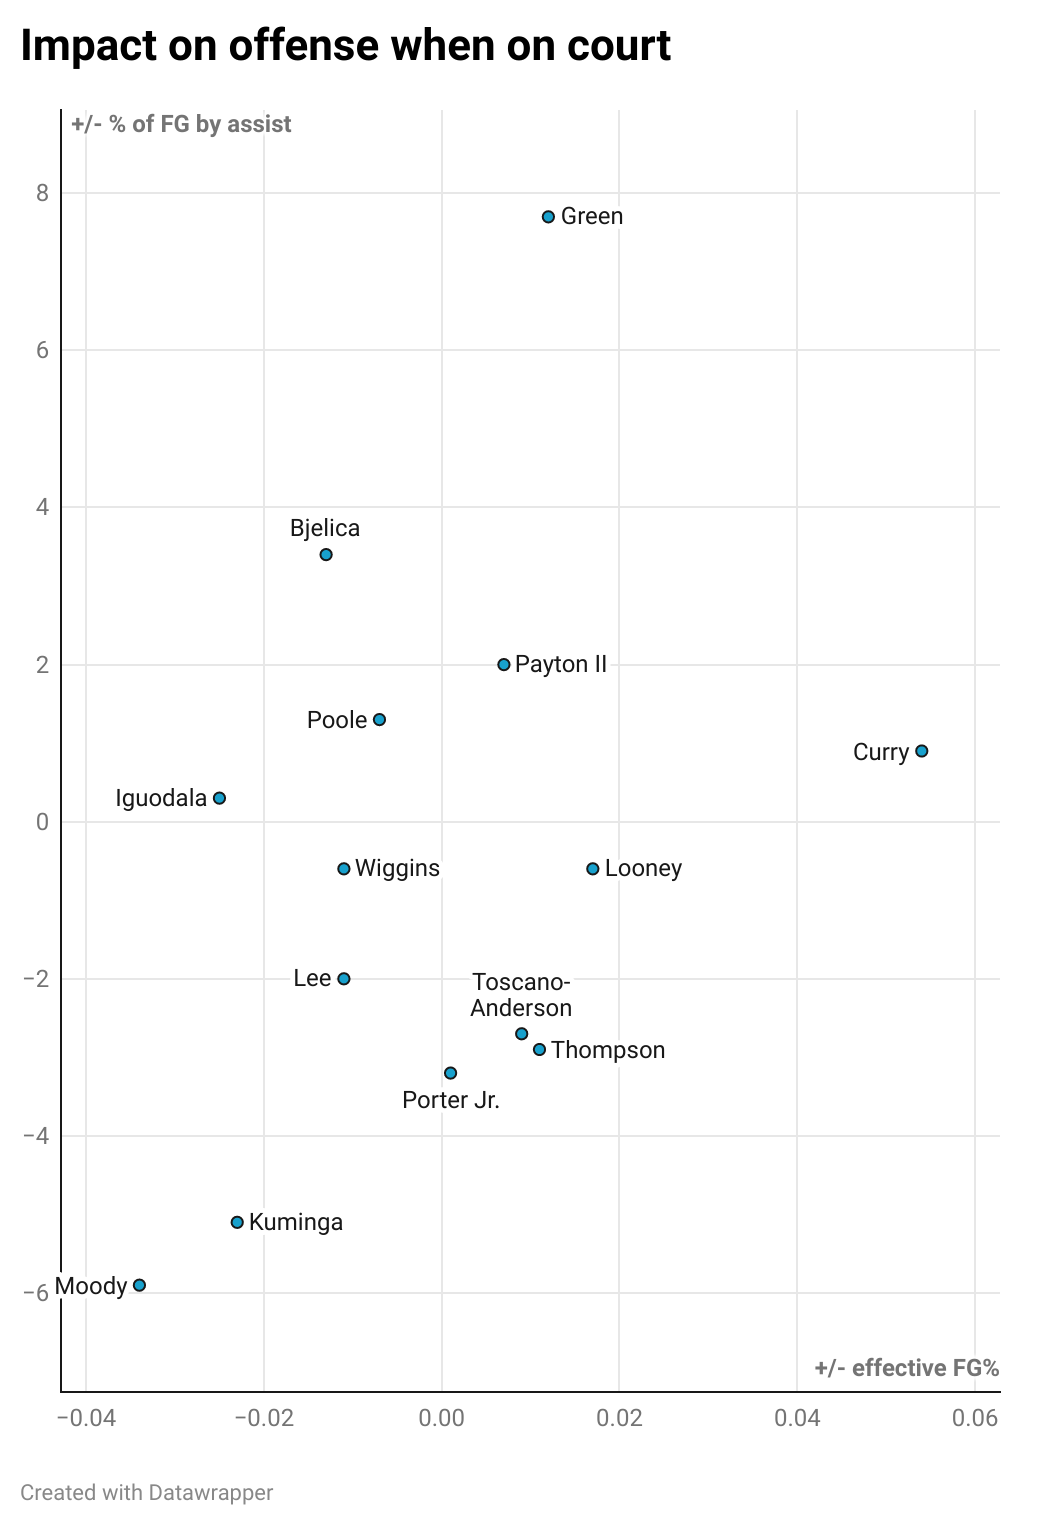
Since 2014-15, the Warriors have six of the top seven NBA assist seasons this century, peeking at 30.4 per game in 2016-17. This season they rank tied for second at 27.2 (San Antonio leads at 28.0). Green supplanted Curry in 2015-16 as the Warriors’ leader in assists, allowing Curry to play more off the ball. Green has led Golden State each season since (minimum 10 games played). The forward’s defensive rebounding creates transition opportunities and his screen-setting, court awareness and acute passing create a fluid half-court offense — all translating to more assists.
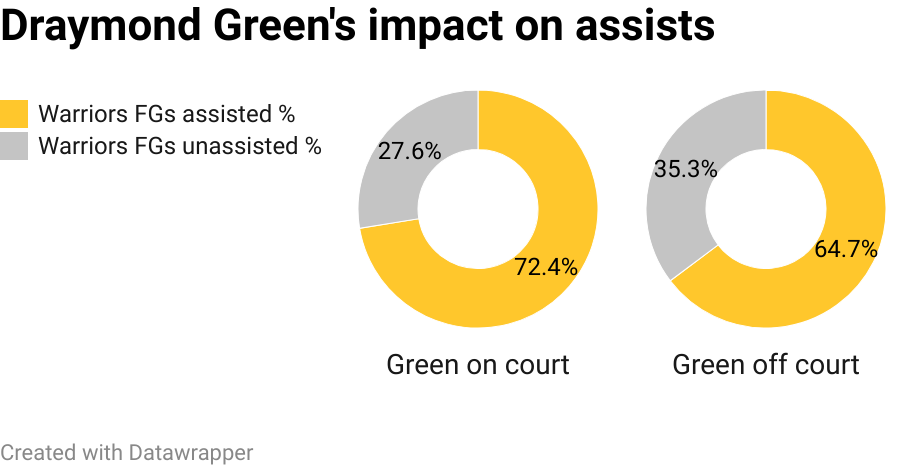
The plot chart below shows Golden State players’ impact on assisted field goals along the vertical axis and effective FG% (adjusting for 3s being worth more points) along the horizontal axis. This season, the Warriors assist on 7.7% more baskets with Green on the court, twice the impact of the next best Warrior (Nemenja Bjelica, +3.4%).